Percona Monitoring and Management 3.0.0 Beta
| Release date | October 16th, 2024 |
|---|---|
| Installation | Installing Percona Monitoring and Management |
Percona Monitoring and Management (PMM) is an open source database monitoring, management, and observability solution for MySQL, PostgreSQL, and MongoDB.
It enables you to observe the health of your database systems, explore new patterns in their behavior, troubleshoot them and execute database management operations—regardless of whether your databases are located on-premises or in the cloud.
Release highlights
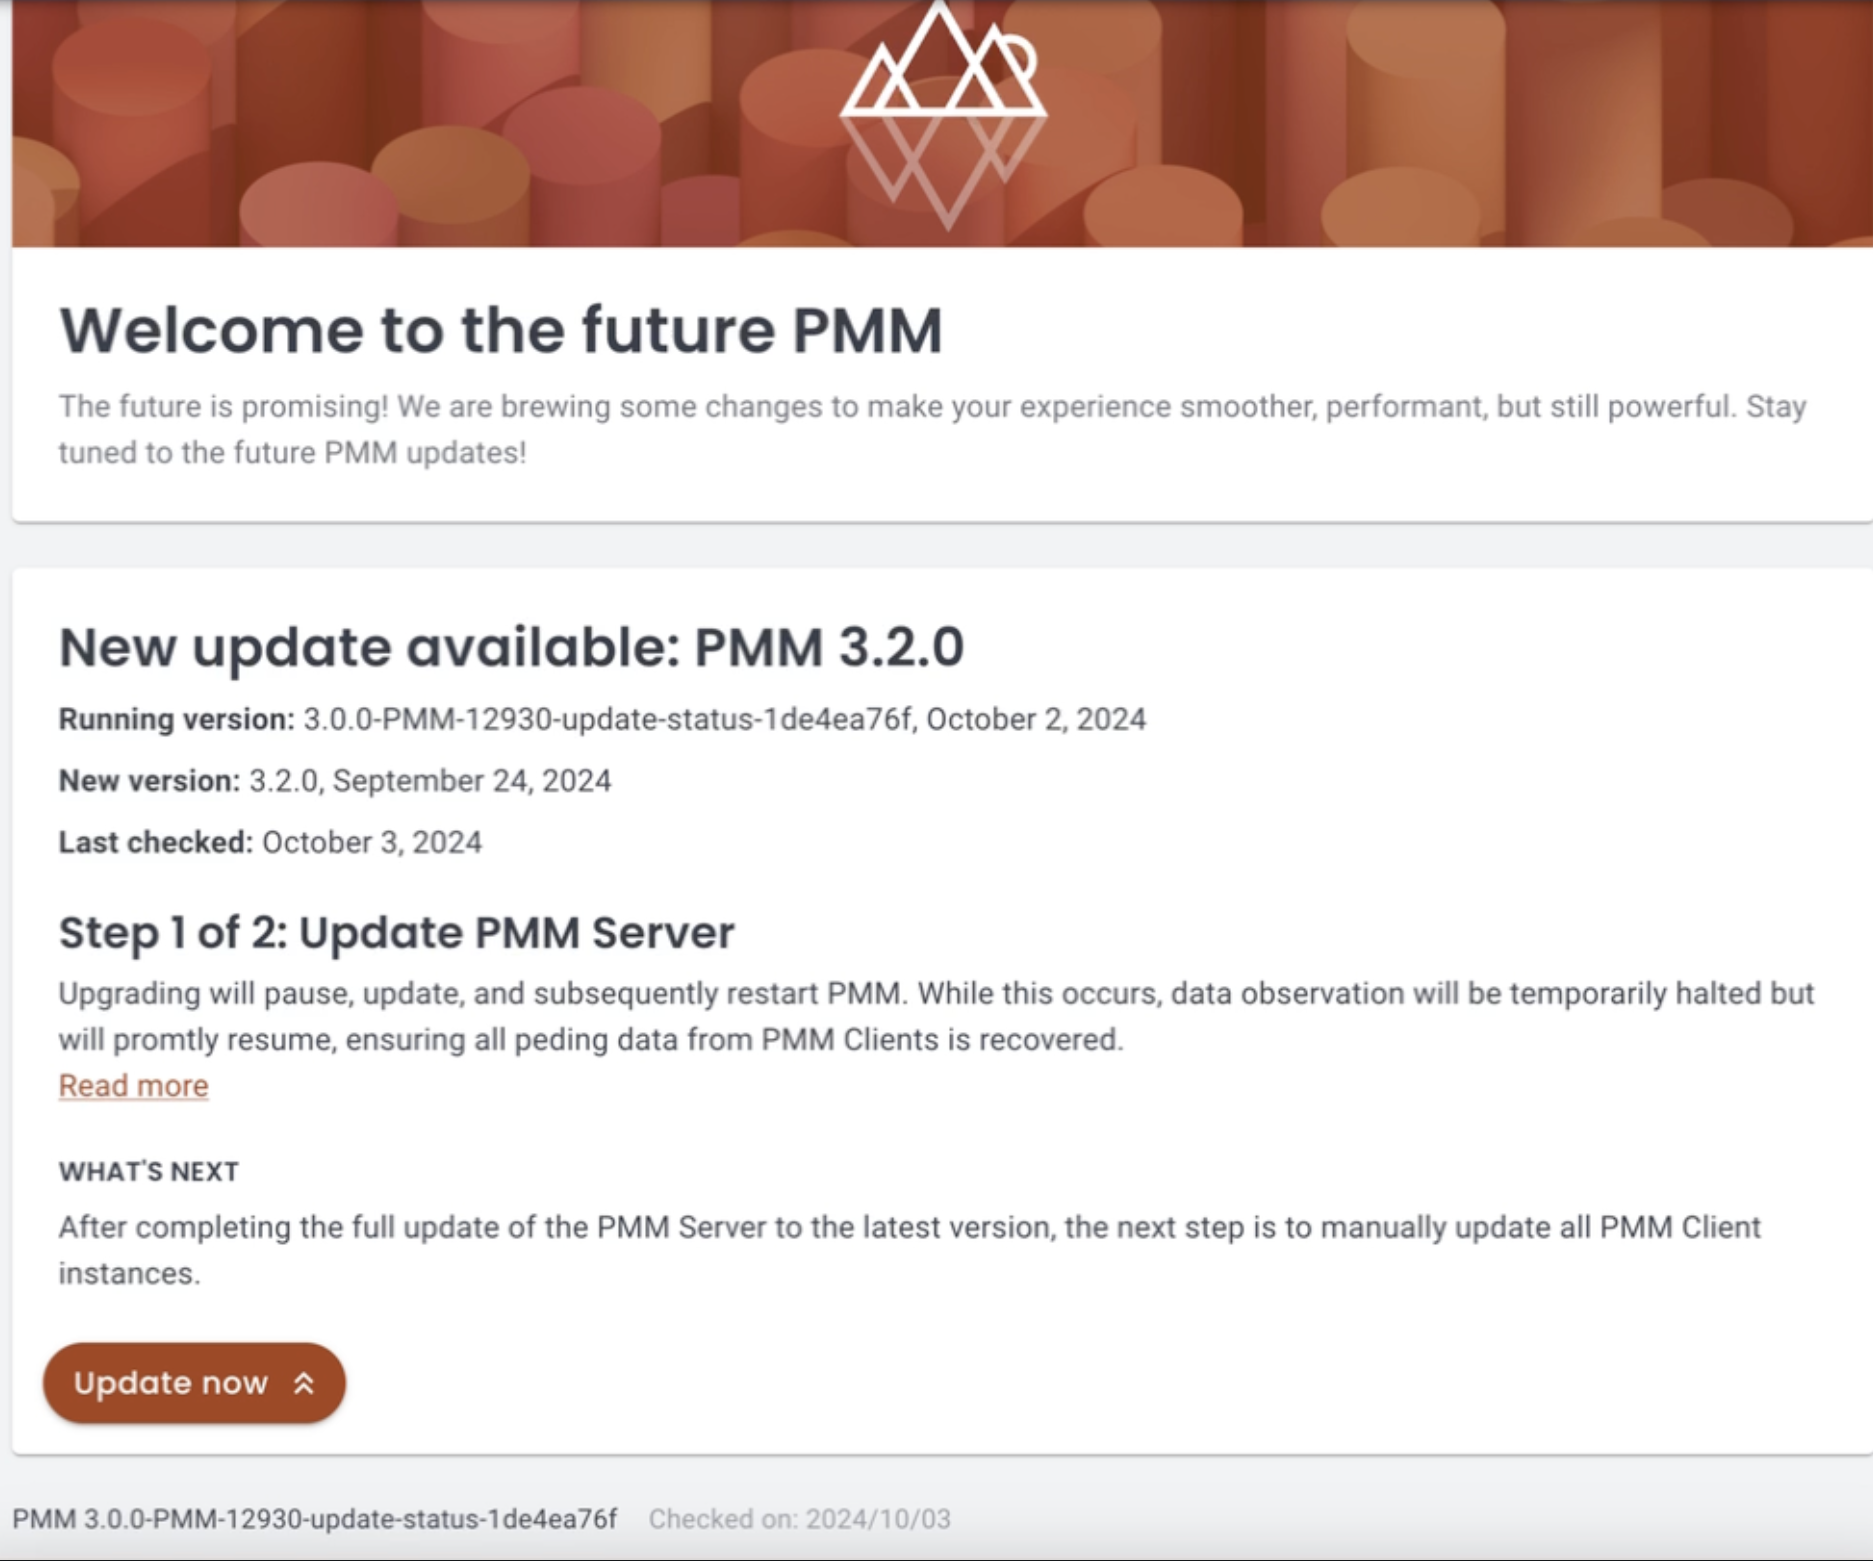
Streamlined update process
We’ve enhanced PMM’s update system with a new Update page, accessible via PMM Configuration > Updates. This new intuitive interface replaces the previous RPM-based update method, allowing you to easily track versions, configurations, and the health status of your PMM Server and Clients.
This change comes with proactive notifications, alerting you immediately when new versions are released, and providing detailed change summaries so you can make informed decisions before upgrading.

New upgrade environment variables
When migrating from PMM v2 to PMM v3, you’ll need to update your environment variables to match the new naming convention. This is because PMM v3 introduces several important changes to improve consistency and clarity:
- environment variables now use PMM_ prefix
- some boolean flags reversed (e.g.,
DISABLE_>ENABLE_) - removed deprecated variables
To check the Migration reference table, see Environment variables in PMM.
Encryption of sensitive data
To strengthen the security of your monitoring setup, all sensitive information stored in the PMM Server database, including usernames, passwords, AWS keys, Azure credentials, and TLS/SSL certificates, is now encrypted.
By default, an encryption key is automatically generated and stored at /srv/pmm-encryption.key. You also have the option to specify a custom path for the encryption key using the new environment variable PMM_ENCRYPTION_KEY_PATH.
When upgrading to PMM 3, any existing unencrypted PMM 2 data will be encrypted automatically.
Distribute monitoring across multiple nodes
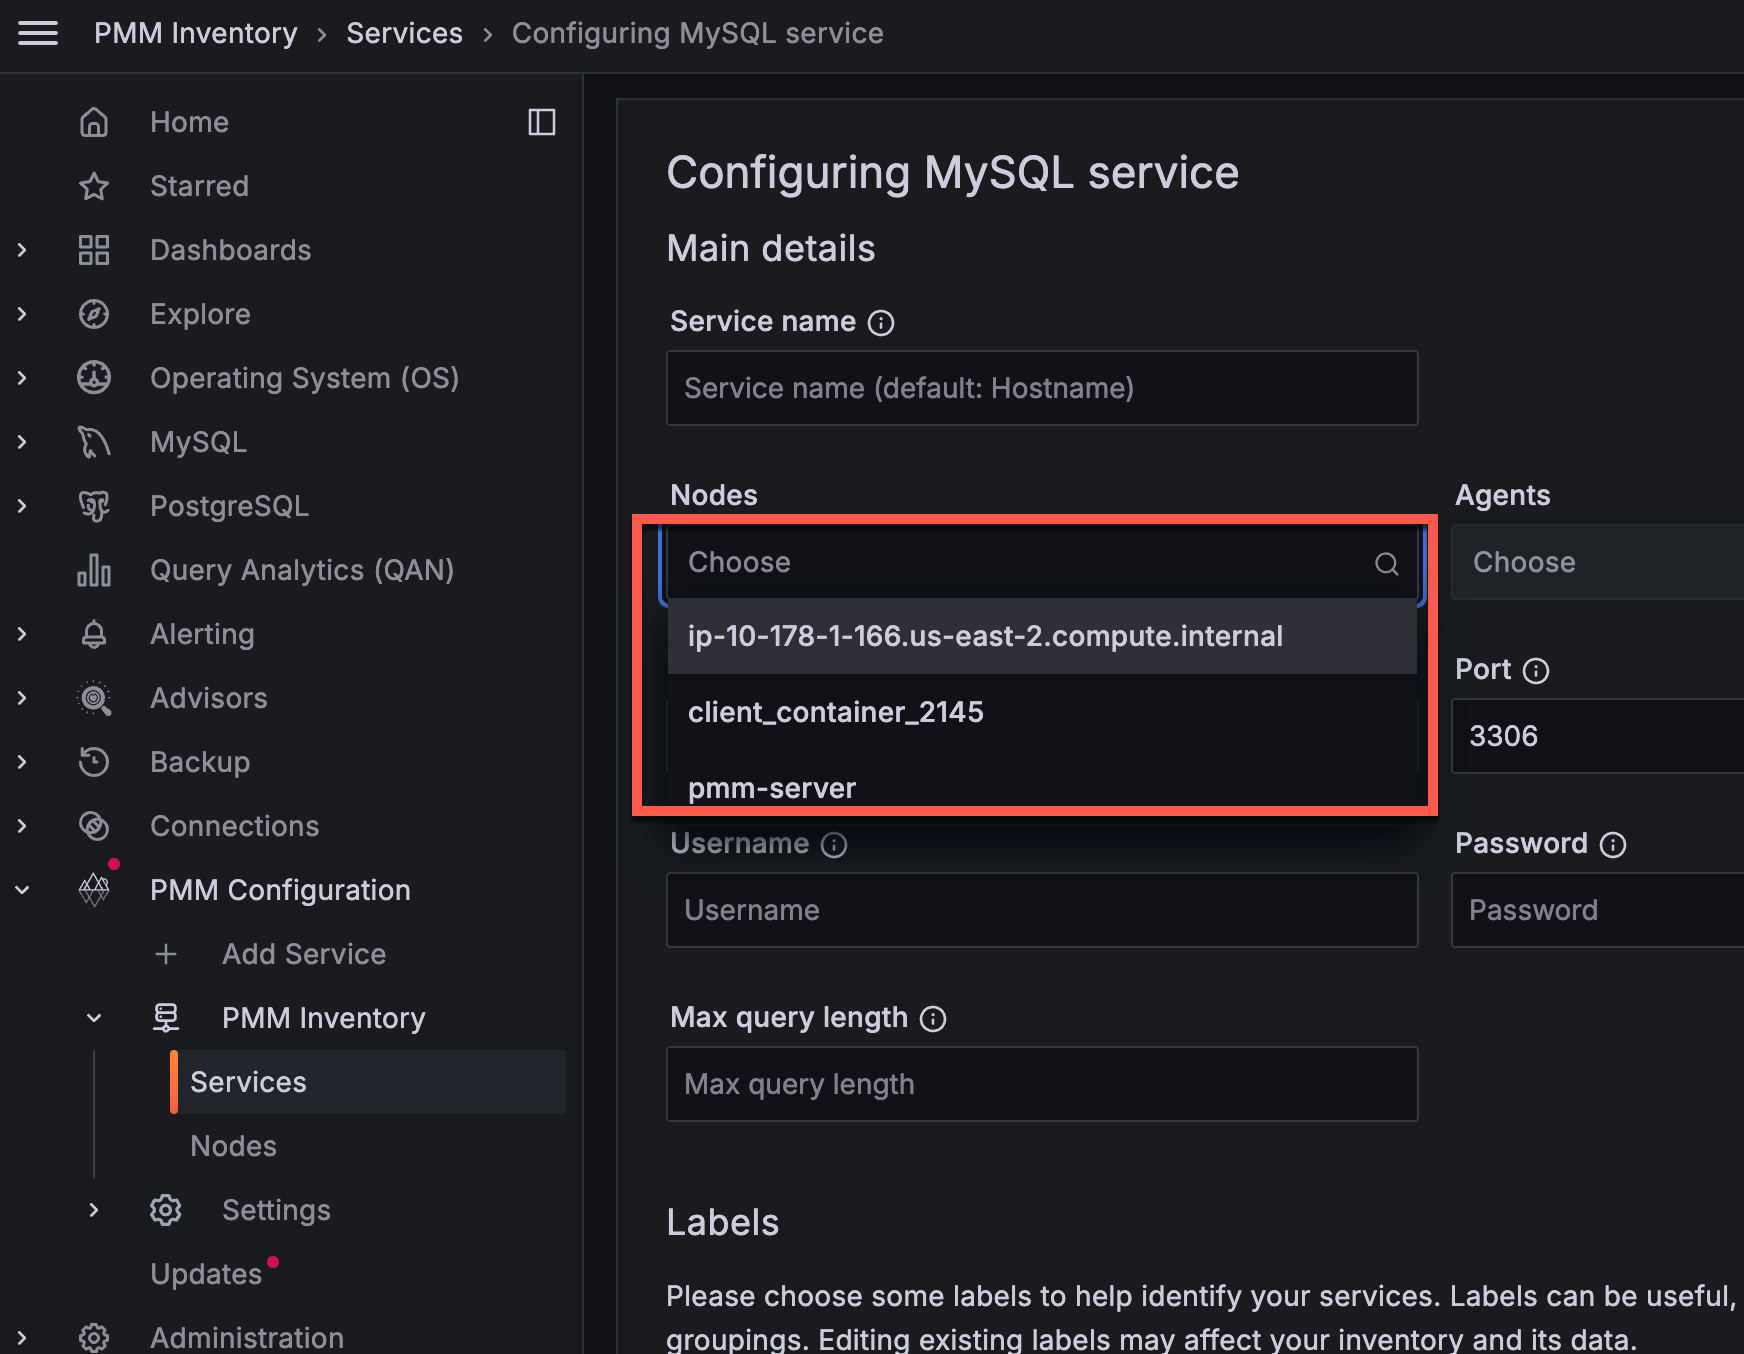
You can now run database exporters from any PMM Client node, which means you can distribute the monitoring load across multiple PMM Clients. This is especially useful for monitoring cloud-hosted databases like RDS.
When adding a new service through the PMM UI, you can now select the node that will run the exporter. By default, PMM Server is chosen, but you have the option to select any node with a PMM Client installed. If a node has multiple Clients installed, you can choose which one to use.
Currently, this feature is available only when adding new services. Support for editing existing services will be included in a future update.
For more details, see Connect services.

For more information, see PMM data encryption.
[Tech Preview] support for PSMDB 8.0
Added initial support for monitoring Percona Server for MongoDB (PSMDB) 8.0 deployments in PMM. This includes updates to mongodb_exporter to accommodate PSMDB 8.0’s revised metrics structure and renamed metrics (e.g., wiredTiger.concurrentTransactions is now queues.execution).
This enhances monitoring, particularly for sharded cluster deployments, and requires PMM Agent version 2.43.1 or later.
Keep in mind that some dashboard metrics may need further updates to fully support MongoDB 8.0’s new format.
Grafana Angular support discontinuation
Grafana will discontinue support for Angular starting with version 12, expected in 2025. This affects numerous panels and plugins, including but not limited to Graph and Table panels.
We have already migrated many plugins to newer technologies and are actively working on the remaining components to ensure continued functionality. We recommend that you review all plugins in your dashboards and begin planning transitions to newer panel types where necessary.
For the full list of affected plugins and guidance on migration, see Grafana’s official documentation on Angular deprecation and plugin migration.
We will provide regular updates on our migration progress in future releases to help you prepare for this change and modernize your dashboards.
Improvements
New default password for AWS Marketplace instances
PMM Server instances launched via AWS Marketplace now use the EC2 instance ID as the default password for the admin user.
This change stems from our recent transition to Docker-based deployment, ensuring secure and consistent initial access across all new AWS Marketplace instances.
Only new PMM instances launched via AWS Marketplace are affected by this update. For existing instances, continue to use ‘admin’ as the default password. Make sure to change the default password immediately after first log in!
For more information, see Install PMM Server on AWS Marketplace.
Increased query length limit for MongoDB in QAN
For MongoDB queries, the default maximum query length in Query Analytics (QAN) is now 4096 characters (up from 2048). This better supports long queries and aggregation pipelines while reducing truncation errors. Other databases retain the 2048-character limit.
Enhanced MySQL SlowLog query identification
Improved MySQL Slow Log query identification by extending the query ID length from 16 to 32 characters. This reduces the likelihood of ID collisions and ensures more accurate and reliable QAN results.
Added monitoring support for default PostgreSQL database
PMM now collects metrics from its internal PostgreSQL database, displaying them in all PostgreSQL dashboards and QAN.
While using the default database isn’t recommended, this provides better monitoring coverage for users who rely on this setup.
Nomad integration for PMM Client
PMM Client packages (DEB, RPM, and tarball) now include the Nomad binary, laying the foundation for expanded functionality in future PMM releases.
While the Nomad binary is now included and properly configured within the PMM Client ecosystem, Nomad agent configuration and execution capabilities will be implemented in future releases, which will unlock more capabilities for PMM.
Service account name length management
To prevent node registration failures, PMM now automatically shortens service account names longer than 200 characters.
PFor this, PMM creates a truncated name in the format {prefix}_{hash}, where:
- prefix: a portion of the original name, providing context
- hash: a unique identifier to avoid naming conflicts
For example, a long node name such as:
Copyvery_long_mysql_database_server_in_production_environment_with_specific_location_details_and_multiple_configuration_settings_for_east_coast_datacenter_primary_backup_replica_instance_2024
would now be shortened to:
Copyvery_long_mysql_database_server_in_prod_4a7b3f9d.
For more information see the Authentication topic.
Automated update support for AMI/OVF deployments
The new Updates page also enables AMI and OVF deployments to update PMM Server directly from the UI, following the integration of the Watchtower container.
Docker version management
Added ability to upgrade PMM Server between different version tags, enabling more flexible version management for Docker-based deployments.
Disabled PostgreSQL telemetry
PMM no longer collects PostgreSQL Pillars telemetry.
This improves compatibility with the upcoming No-root feature and streamlines configuration by relying on PMM’s own telemetry capabilities.
Internal improvements: System infrastructure and telemetry
We’ve enhanced PMM’s internal architecture with key updates to system maintenance and telemetry. The telemetry system now connects to Percona’s unified endpoint, aligning PMM with other Percona products for more streamlined and consistent data collection.
We’ve also optimized deployment scripts to improve system maintenance efficiency and reliability.
Components upgrade
We’ve upgraded following PMM components to their latest stable versions to enhance functionality, security, and performance:
-
Grafana 11.1.8: Includes significant improvements over the previous version 9.2.20 integration in PMM2. For the full list of Grafana changes included with this update, see Grafana’s 11.1.8 changelog and Grafana release highlights.
-
ClickHouse Datasource plugin: Updated to address security vulnerabilities and maintain system integrity. This update ensures continued reliable operation of ClickHouse-related dashboards.
-
Node Exporter 1.8.2: Latest stable release improves system metrics collection with upstream enhancements and fixes.
-
ClickHouse-go driver: Upgraded QAN to use version 2 of the driver, improving database connectivity and performance.
Breaking API changes
This release introduces major breaking API changes:
- Database record identifiers no longer use prefixes (e.g.,
/agent_id/) and are now represented as plain UUIDs. - Feature toggles have been simplified from dual booleans to a single boolean control with an
enable_featureproperty. - API responses now consistently emit all fields including those with default or zero values.
- Service, node, and agent management has been streamlined through consolidated endpoints where the resource type is specified as a top-level property in the request payload.
- Low-level Inventory API sections have been removed from documentation in favor of the Management API for inventory-related tasks.
For detailed information about all these API changes and new endpoints, see the PMM API documentation.
Fixed issues
-
PMM-13452: - Fixed an issue where QAN was not displaying data in the Details tab when selecting a query.
-
PMM-13417 - Fixed Service Summary panel returning 404 error on the PostgreSQL Instance Summary dashboard.
-
PMM-13280 - Fixed SSH connectivity issue that prevented users from connecting to OVF instances using SSH keys.
-
PMM-13265 - Fixed error preventing creation of alert rules from the pmm_postgresql_too_many_connections template.
-
PMM-13280 - Fixed “Permission Denied” errors when trying to SSH into OVF instances using configured SSH keys.
-
PMM-13250 - Fixed “Method RestoreBackup not implemented” error that occurred when initiating backup restoration through the API.
-
PMM-13122 - Fixed navigation between pages to properly maintain selected service names and timeframes when switching between different dashboards and metrics views.
-
PMM-12949 - Fixed an issue where the Set up page was incorrectly displayed on Docker and OVF installations; it now properly redirects to the Log in page instead.
-
PMM-12776 - Fixed RBAC metrics filtering functionality that was affected by Grafana 10 upgrade, restoring proper access control rules for metrics.
-
PMM-12013 - Fixed reliability and memory usage issues with RDS monitoring in large deployments by running separate RDS exporters per AWS access key. This improves metric collection stability and reduces memory consumption when monitoring multiple RDS instances.
Get expert help
If you need assistance, you can find comprehensive and free database knowledge on our community forum or blog posts. For professional support and services, contact our Percona Database Experts.