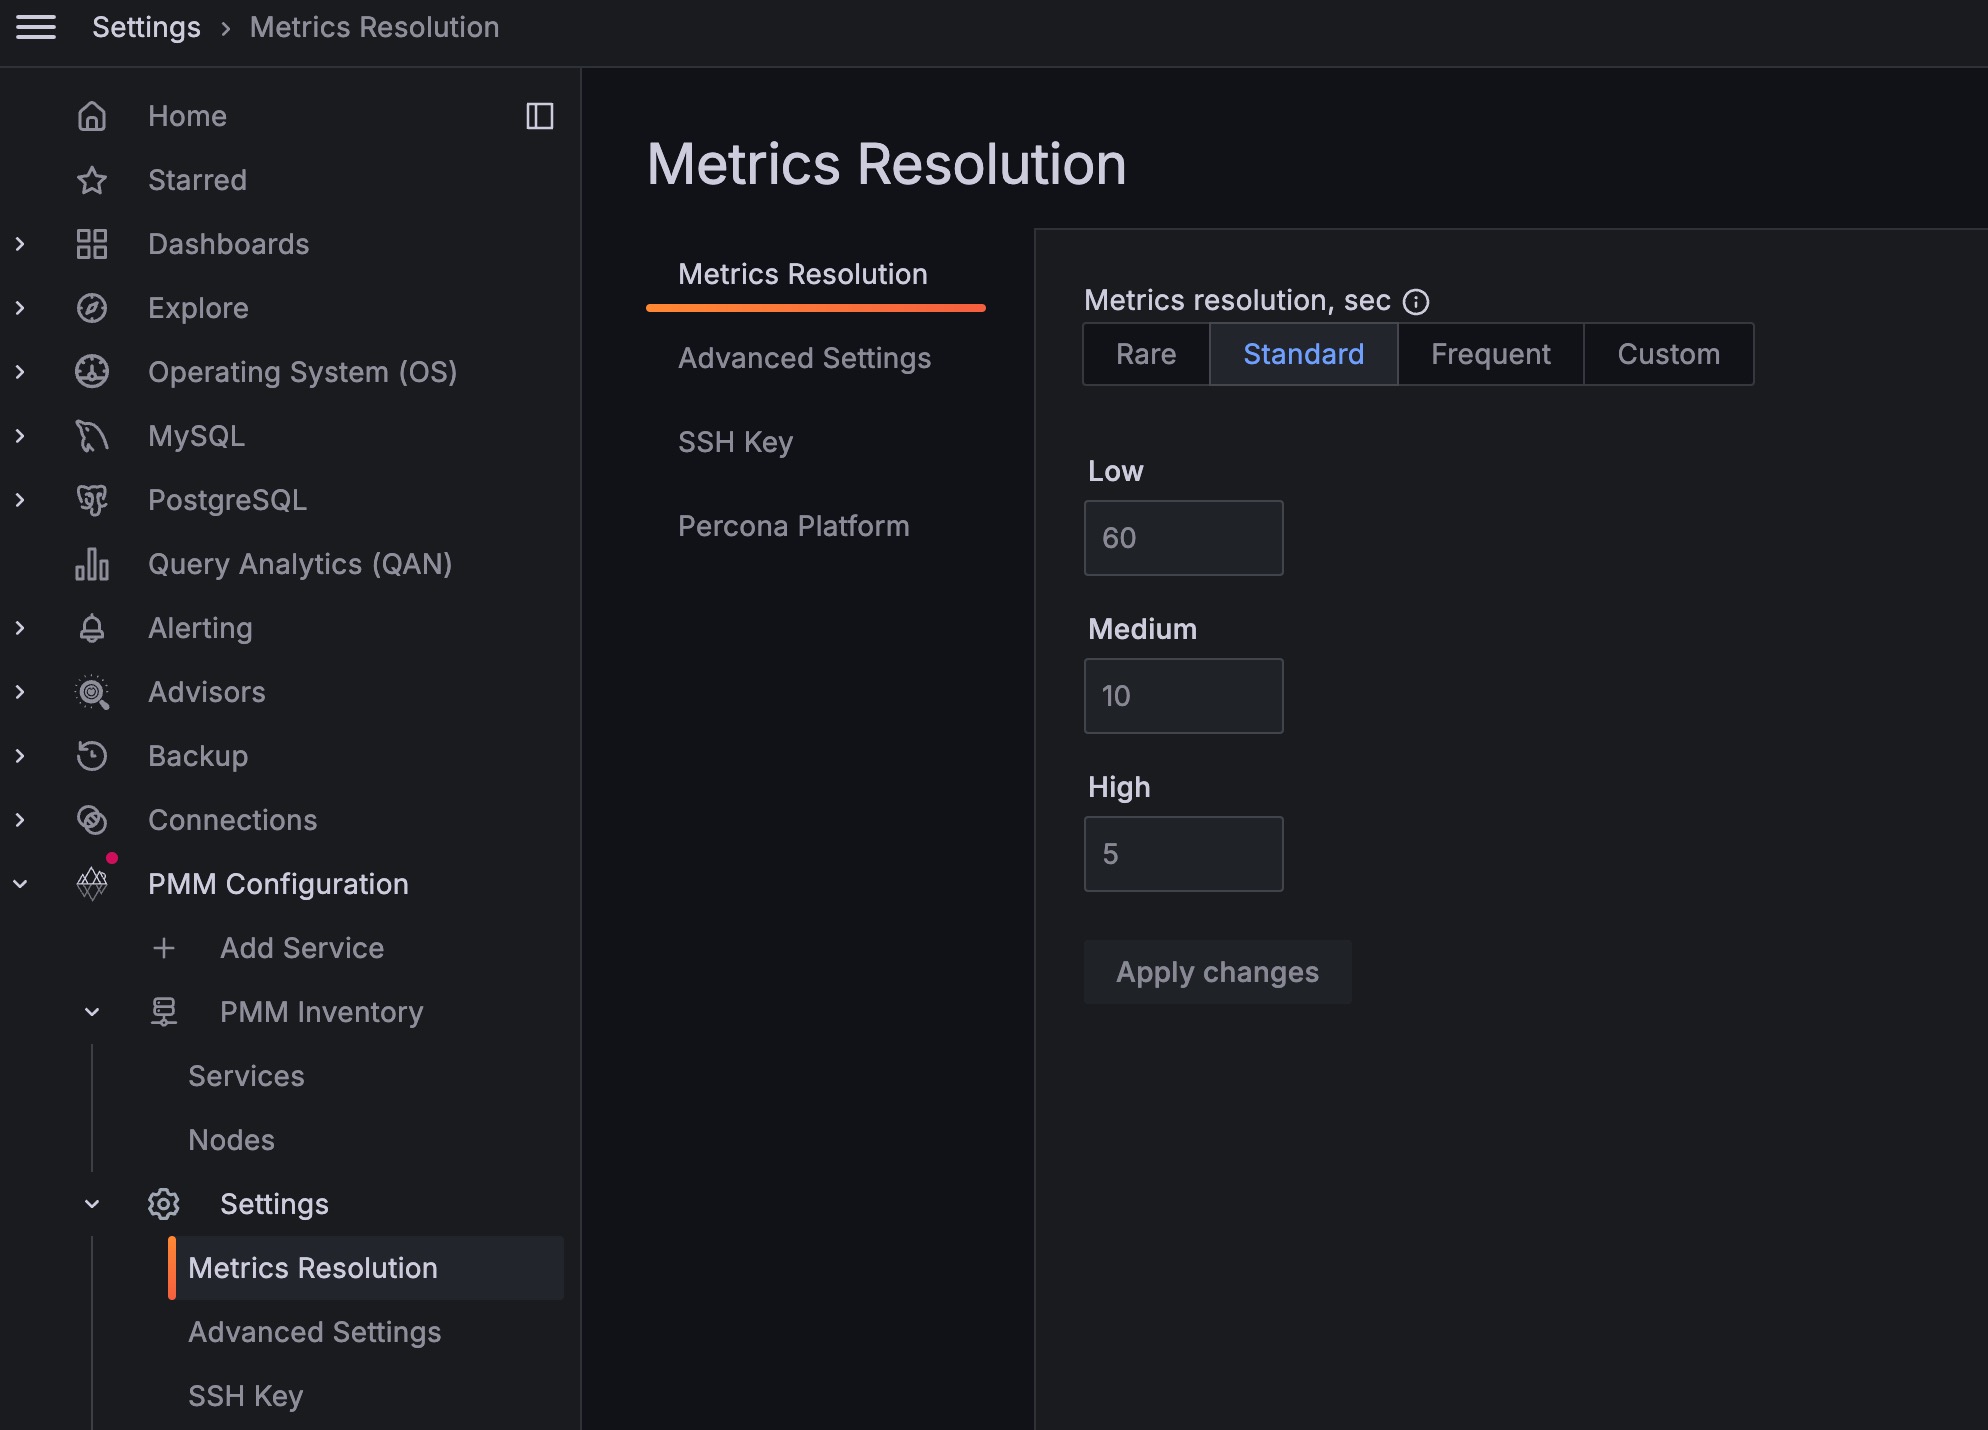
Metrics resolution
Metrics are collected at three intervals representing low, medium and high resolutions.
The Metrics Resolution settings tab contains three fixed presets (Rare, Standard and Frequent) and an editable custom preset (Custom). Each preset is a group of low, medium and high resolutions. The values are in seconds.

Time intervals and resolutions
Short time intervals are high resolution metrics. Longer time intervals are low resolution. So:
- A low resolution interval increases the time between collection, resulting in low-resolution metrics and lower disk usage.
- A high resolution interval decreases the time between collection, resulting in high-resolution metrics and higher disk usage.
The default values (in seconds) for the fixed presets and their resolution names are:
| Editable? | Preset | Low | Medium | High |
|---|---|---|---|---|
| No | Rare | 300 | 180 | 60 |
| No | Standard | 60 | 10 | 5 |
| No | Frequent | 30 | 5 | 1 |
| Yes | Custom (defaults) | 60 | 10 | 5 |
Values for the Custom preset can be entered as values, or changed with the arrows.
Note
If there is poor network connectivity between PMM Server and PMM Client, or between PMM Client and the database server being monitored, scraping every second may not be possible when the network latency is greater than 1 second.
Get expert help
If you need assistance, you can find comprehensive and free database knowledge on our community forum or blog posts. For professional support and services, contact our Percona Database Experts.