Connect HAProxy instance
Adding HAProxy
You can collect metrics from HAProxy on a node when:
-
There is already a configured haproxy instance.
- After HAProxy is running (default address http://localhost:8404/metrics) you can add it to PMM.
-
Use the
haproxyalias to enable HAProxy metrics monitoring. -
There is already a pmm-agent instance running.
-
This node has been configured using the
pmm-admin configcommand.
USAGE
pmm-admin add haproxy --listen-port=8404
where listen-port is the port number where HAProxy running. (This is the only required flag.)
The output of this command should look as follows:
HAProxy Service added.
Service ID  : c481183f-70a2-443f-91e5-cae5cecd06a2
Service name: Ubuntu-haproxy
Additionally, one positional argument can be appended to the command line flags: a service name to be used by PMM. If not specified, they are substituted automatically as <node>-haproxy.
During adding here is connection check (can be skipped by flag --skip-connection-check). If HAProxy doesn’t run properly on the given port then you will see an error message:
Connection check failed: Get "http://127.0.0.1:8404/metrics": dial tcp 127.0.0.1:8404: connect: connection refused.
Beside positional argument shown above you can specify service name with the following flags: --username, --password, --metrics-path (path for scraping metrics, default: /metrics) and --scheme (http or https). Here are some examples:
pmm-admin add haproxy --listen-port=8404 --username=pmm --password=pmm new-haproxy
pmm-admin add haproxy --listen-port=8404 --metrics-path=/prom-metrics --scheme=https
Here you can check list of all available flags: pmm-admin.
You can also add HAProxy by UI: Select PMM Configuration > PMM Inventory > Add Instance.
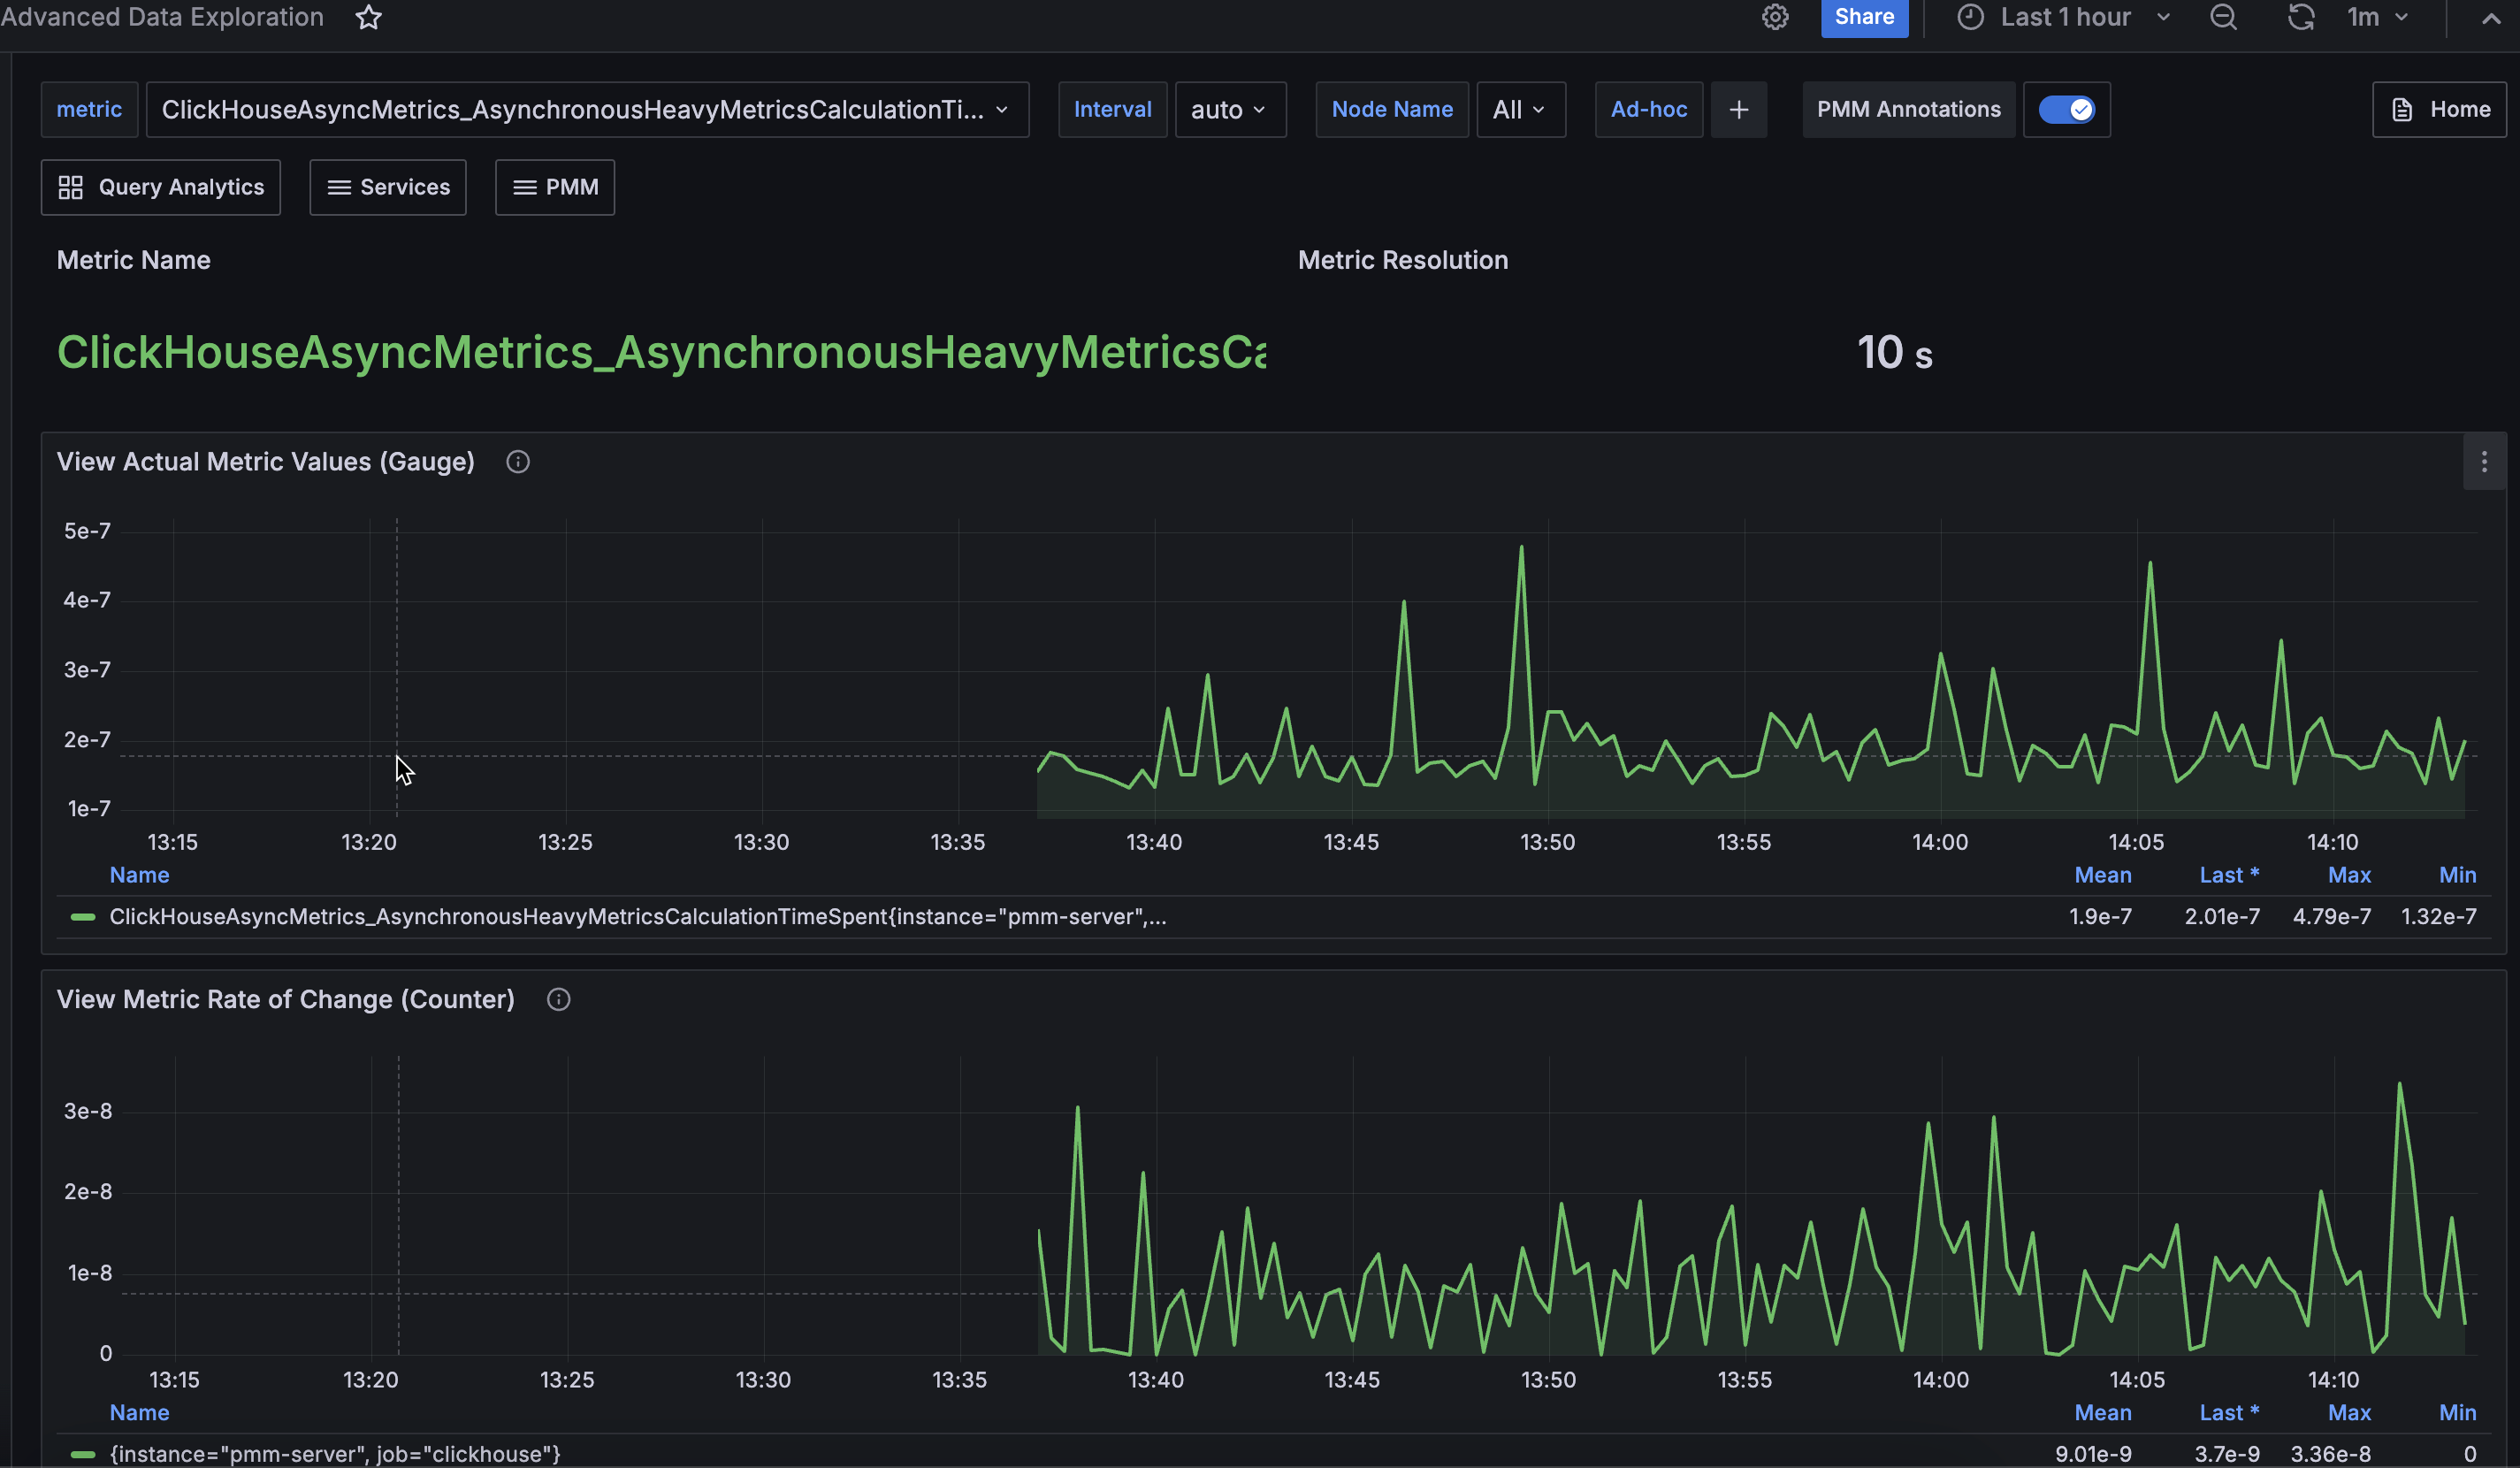
HAProxy data is visible in the Advanced Data Exploration dashboard:

Get expert help
If you need assistance, you can find comprehensive and free database knowledge on our community forum or blog posts. For professional support and services, contact our Percona Database Experts.