Connect MongoDB instance
How to set up PMM to monitor a MongoDB or Percona Server for MongoDB database instance.
Before you start
Check that:
- PMM Server is installed and running with a known IP address or hostname accessible from the client node.
- PMM Client is installed and the nodes are registered with PMM Server.
- You have superuser (root) access on the client host.
- You have
adminUserAnyDatabaseor superuser role privilege to any database servers that you want to monitor. - Your MongoDB server is version 4.0 or higher.
Create PMM account and set permissions
We recommend using a dedicated account to connect PMM Client to the monitored database instance.
Run the example codes below in a mongo session to:
- create custom roles with the privileges required for creating/restoring backups and working with Query Analytics (QAN)
- create/update a database user with these roles above, plus the built-in
clusterMonitorrole
Values for username (user) and password (pwd) are examples. Replace them before using these code snippets.
db.getSiblingDB("admin").createRole({
    role: "explainRole",
    privileges: [{
        resource: {
            db: "",
            collection: ""
            },
        actions: [
            "listIndexes",
            "listCollections",
            "dbStats",
            "dbHash",
            "collStats",
            "find"
            ]
        }],
    roles:[]
})

db.getSiblingDB("admin").createRole({ "role": "pbmAnyAction",
    "privileges": [
    { "resource": { "anyResource": true },
        "actions": [ "anyAction" ]
    }
    ],
    "roles": []
 });
db.getSiblingDB("admin").createUser({
    user: "pmm",
    pwd: "pmm",
    roles: [
        { role: "explainRole", db: "admin" },
        { role: "clusterMonitor", db: "admin" },
        { role: "read", db: "local" },
        { "db" : "admin", "role" : "readWrite", "collection": "" },
        { "db" : "admin", "role" : "backup" },
        { "db" : "admin", "role" : "clusterMonitor" },
        { "db" : "admin", "role" : "restore" },
        { "db" : "admin", "role" : "pbmAnyAction" }
    ]
})
db.getSiblingDB("admin").updateUser("pmm", {
roles: [
    { role: "explainRole", db: "admin" },
    { role: "clusterMonitor", db: "admin" },
    { role: "read", db: "local" },
    { "db" : "admin", "role" : "readWrite", "collection": "" },
    { "db" : "admin", "role" : "backup" },
    { "db" : "admin", "role" : "clusterMonitor" },
    { "db" : "admin", "role" : "restore" },
    { "db" : "admin", "role" : "pbmAnyAction" }
]
})
Permissions for advanced metrics
To fetch advanced metrics like usage statistics for collection and indexes, use the following to provide additional privileges to an existing PMM user:
db.getSiblingDB("admin").updateRole(
  "explainRole",
  {
    privileges: [
      {
        resource: { db: "", collection: "" },
        actions: ["collStats", "dbStats", "indexStats"]
      }
    ]
  }
)
Profiling
To use PMM Query Analytics, you must turn on MongoDB’s profiling feature.
You can set profiling:
- permanently, by editing the MongoDB configuration file and restarting the database instance (recommended);
- when starting MongoDB, by passing arguments to
mongodon the command line; - until the next database instance restart, by running a command in a
mongosession.
Profiling is turned off by default as it can adversely affect the performance of the database server.
Set profiling in the configuration file
To set profiling in the configuration file:
-
Edit the configuration file (usually
/etc/mongod.conf). -
Create or add this to the
operationProfilingsection. (Read more.)operationProfiling: mode: all slowOpThresholdMs: 200 rateLimit: 100 # (Only available with Percona Server for MongoDB.)Important
This is a YAML file. Indentation matters.
-
Restart the
mongodservice. (Example forsystemd.)systemctl restart mongod
Set profiling on the command Line
mongod --dbpath=DATABASEDIR --profile 2 --slowms 200 --rateLimit 100
--dbpath: The path to database files (usually/var/lib/mongo).--profile: The MongoDB profiling level. A value of2tells the server to collect profiling data for all operations. To lower the load on the server, use a value of1to only record slow operations.--slowms: An operation is classified as slow if it runs for longer than this number of milliseconds.-
--rateLimit: (Only available with Percona Server for MongoDB.) The sample rate of profiled queries. A value of100means sample every 100th fast query. (Read more.)Caution
Smaller values improve accuracy but can adversly affect the performance of your server.
Set profiling in a mongo session
In a mongo session, the profiler should be enabled per database.
For example, to enable the profiler in the testdb, run this:
use testdb
db.setProfilingLevel(2, {slowms: 0})
If you have already added a service, you should remove it and re-add it after changing the profiling level.
Add service
When you have configured your database server, you can add a MongoDB service with the user interface or on the command line.
Important
To monitor MongoDB sharded clusters, PMM requires access to all cluster components. Make sure to add all config servers, shards, and mongos. Otherwise, PMM will not be able to correctly collect metrics and populate dashboards.
With the user interface
To add a service with the UI:
-
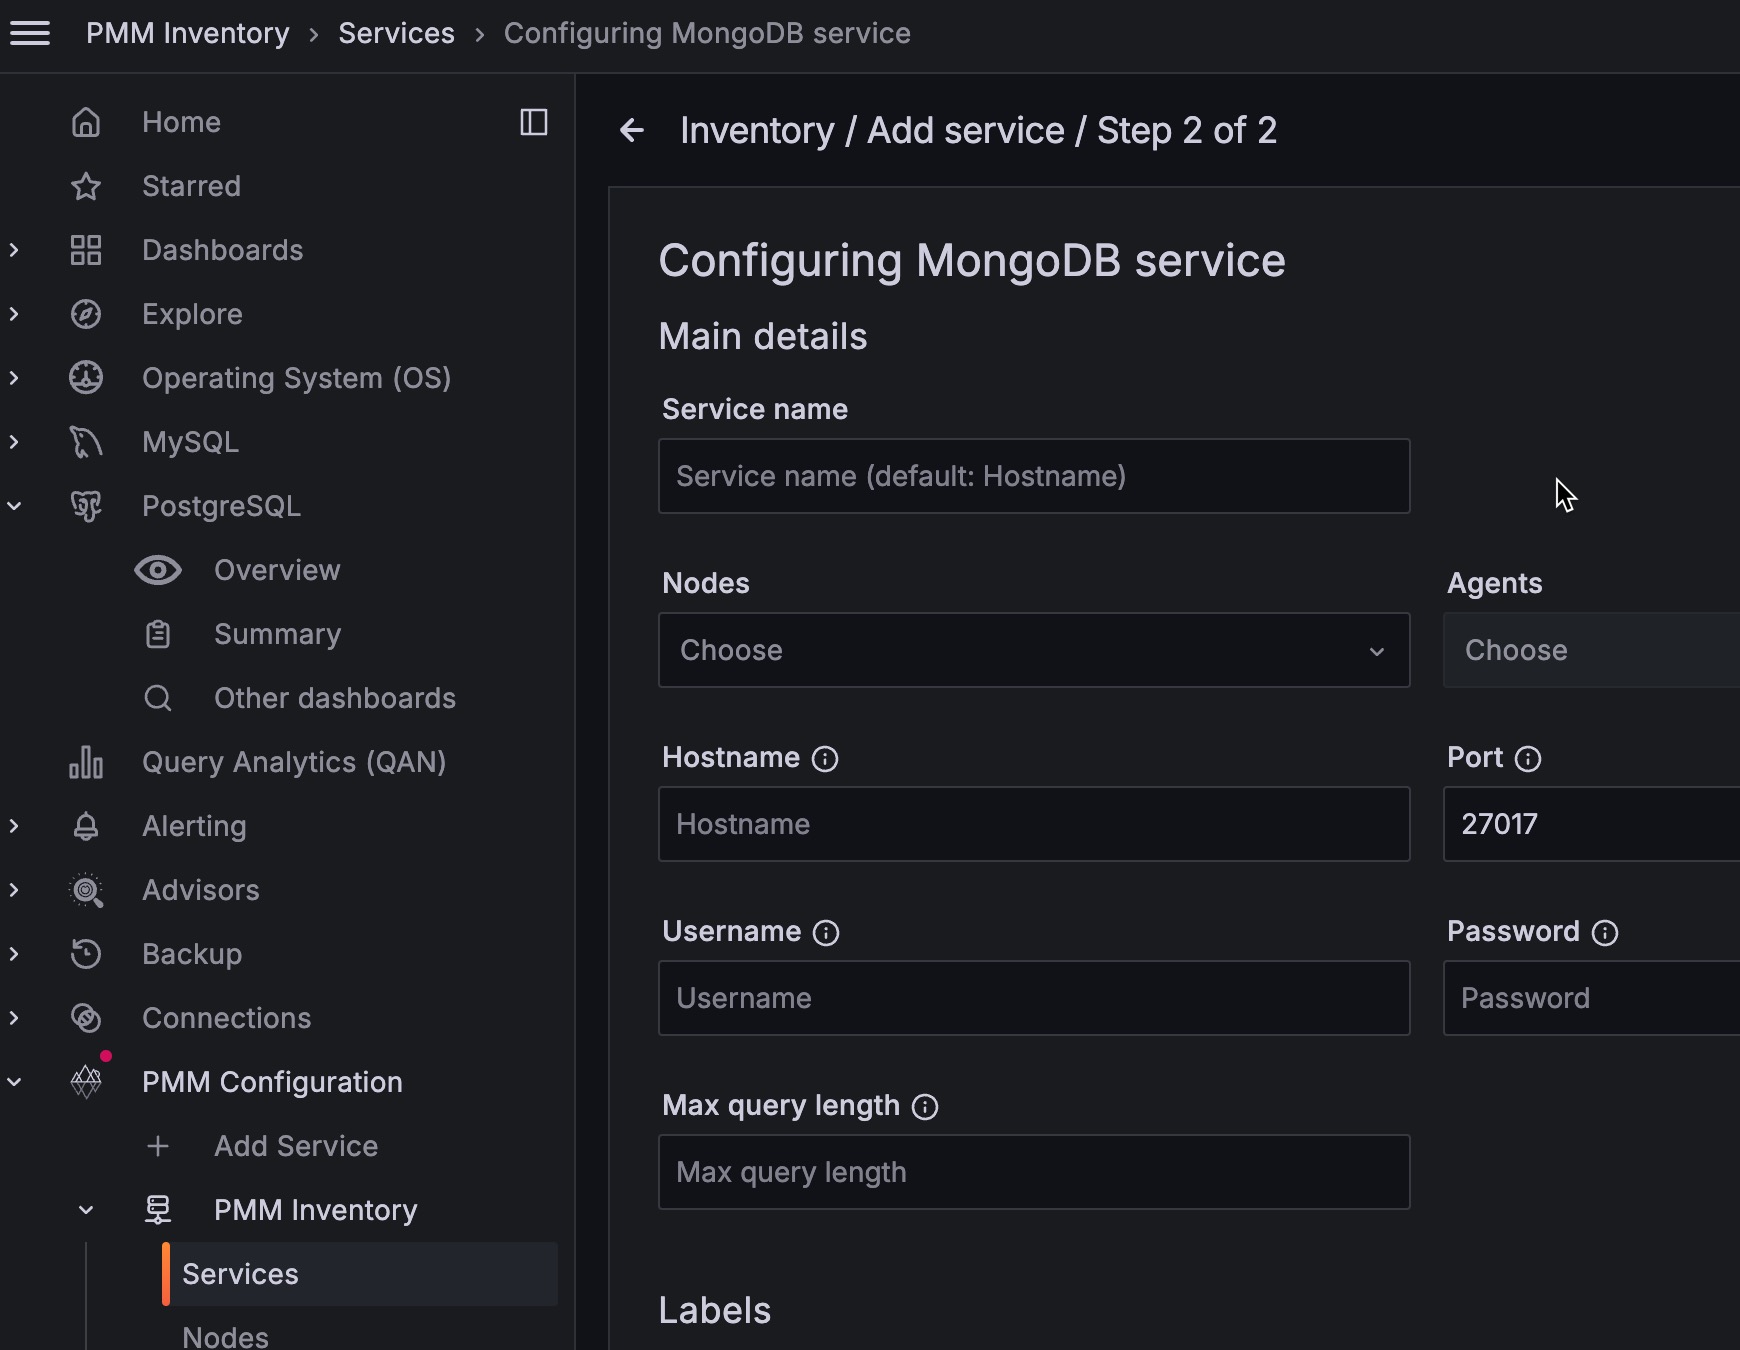
Select PMM Configuration > Add Service > MongoDB.
-
Enter or select values for the fields.
-
Click Add service.

On the command line
Use pmm-admin to add the database server as a service using one of these example commands.
When successful, PMM Client will print MongoDB Service added with the service’s ID and name. Use the --environment and -custom-labels options to set tags for the service to help identify them.
Tips
- When adding nodes of a sharded cluster, add each node separately using the
--cluster myclusteroption for the MongoDB Cluster Summary dashboard to populate correctly. Also use the--replication-setoption to specify a replication set. Example:--replication-set configfor your config servers;--replication-set rs1for your servers in the first replica set,--replication-set rs2for your servers in the second replica set, and so on. - Atlas doesn’t support direct connections. When connecting to an Atlas instance, use the
pmm-adminoption--direct-connection=false. (Doing so will prevent replicaset status from working and the MongoDB Overview dashboard widget will show invalid values.)
Examples
pmm-admin add mongodb \
--username=pmm_mongodb --password=password \
--query-source=profiler --cluster=mycluster
pmm-admin add mongodb \
--username=pmm_mongodb --password=password \
mongo 127.0.0.1:27017
pmm-admin add mongodb \
--username=pmm_mongodb --password=password \
--service-name=mymongosvc --host=127.0.0.1 --port=27017
Connect via UNIX socket
pmm-admin add mongodb --socket=/tmp/mongodb-27017.sock
Connecting via SSL/TLS
pmm-admin add mongodb --tls \
--tls-certificate-key-file=PATHTOCER \
--tls-certificate-key-file-password=IFPASSWORDTOCERTISSET \
--tls-ca-file=PATHTOCACERT
--authentication-mechanism=AUTHENTICATION-MECHANISM
--authentication-database=AUTHENTICATION-DATABASE
where:
PATHTOCERT: Path to TLS certificate file.IFPASSWORDTOCERTISSET: Password for TLS certificate file.PATHTOCACERT: Path to certificate authority file.AUTHENTICATION-MECHANISM: Authentication mechanism. Default is empty. UseMONGODB-X509for SSL certificates.AUTHENTICATION-DATABASE: Authentication database. Default is empty. Use$externalfor SSL certificates.
Check the service
From the user interface
To check the servie from the UI:
-
Select PMM Configuration > Inventory > MongoDB.
-
Enter or select values for the fields.
-
Click Add service.

On the command line
Look for your service in the output of this command.
pmm-admin inventory list services --service-type=mongodb
Check data
To check the data:
- Open the MongoDB Instances Overview dashboard.
- Set the Service Name to the newly-added service.
Query Analytics
To see the query analytics for the service:
- Open PMM Query Analytics.
- In the Filters panel:
- Under Service Name, select your service.
- Under Service Type select
mongodb.
Remove service
With the user interface
To remove the service from the UI:
- Select PMM Configuration > Inventory.
- In the Services tab, verify the Service name, Addresses, and any other relevant values used when adding the service.
- In the Options column, expand the Details section and check that the Agents are using the desired data source.
-
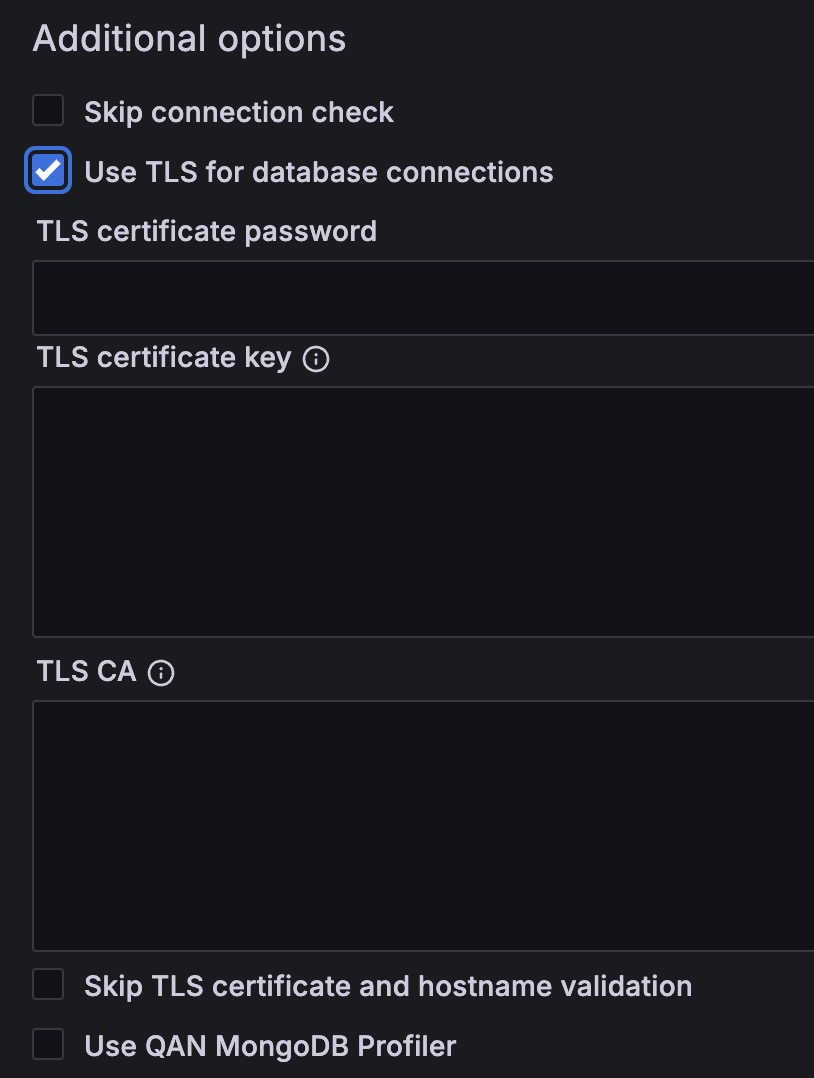
If your MongoDB instance is configured to use TLS, click on the Use TLS for database connection check box and fill in TLS certificates and keys. If you use TLS, the authentication mechanism is automatically set to
MONGODB-X509.
On the command line
pmm-admin remove mongodb SERVICE_NAME
SERVICE_NAME: The name the service was added as. (Find it withpmm-admin list.)
Get expert help
If you need assistance, you can find comprehensive and free database knowledge on our community forum or blog posts. For professional support and services, contact our Percona Database Experts.