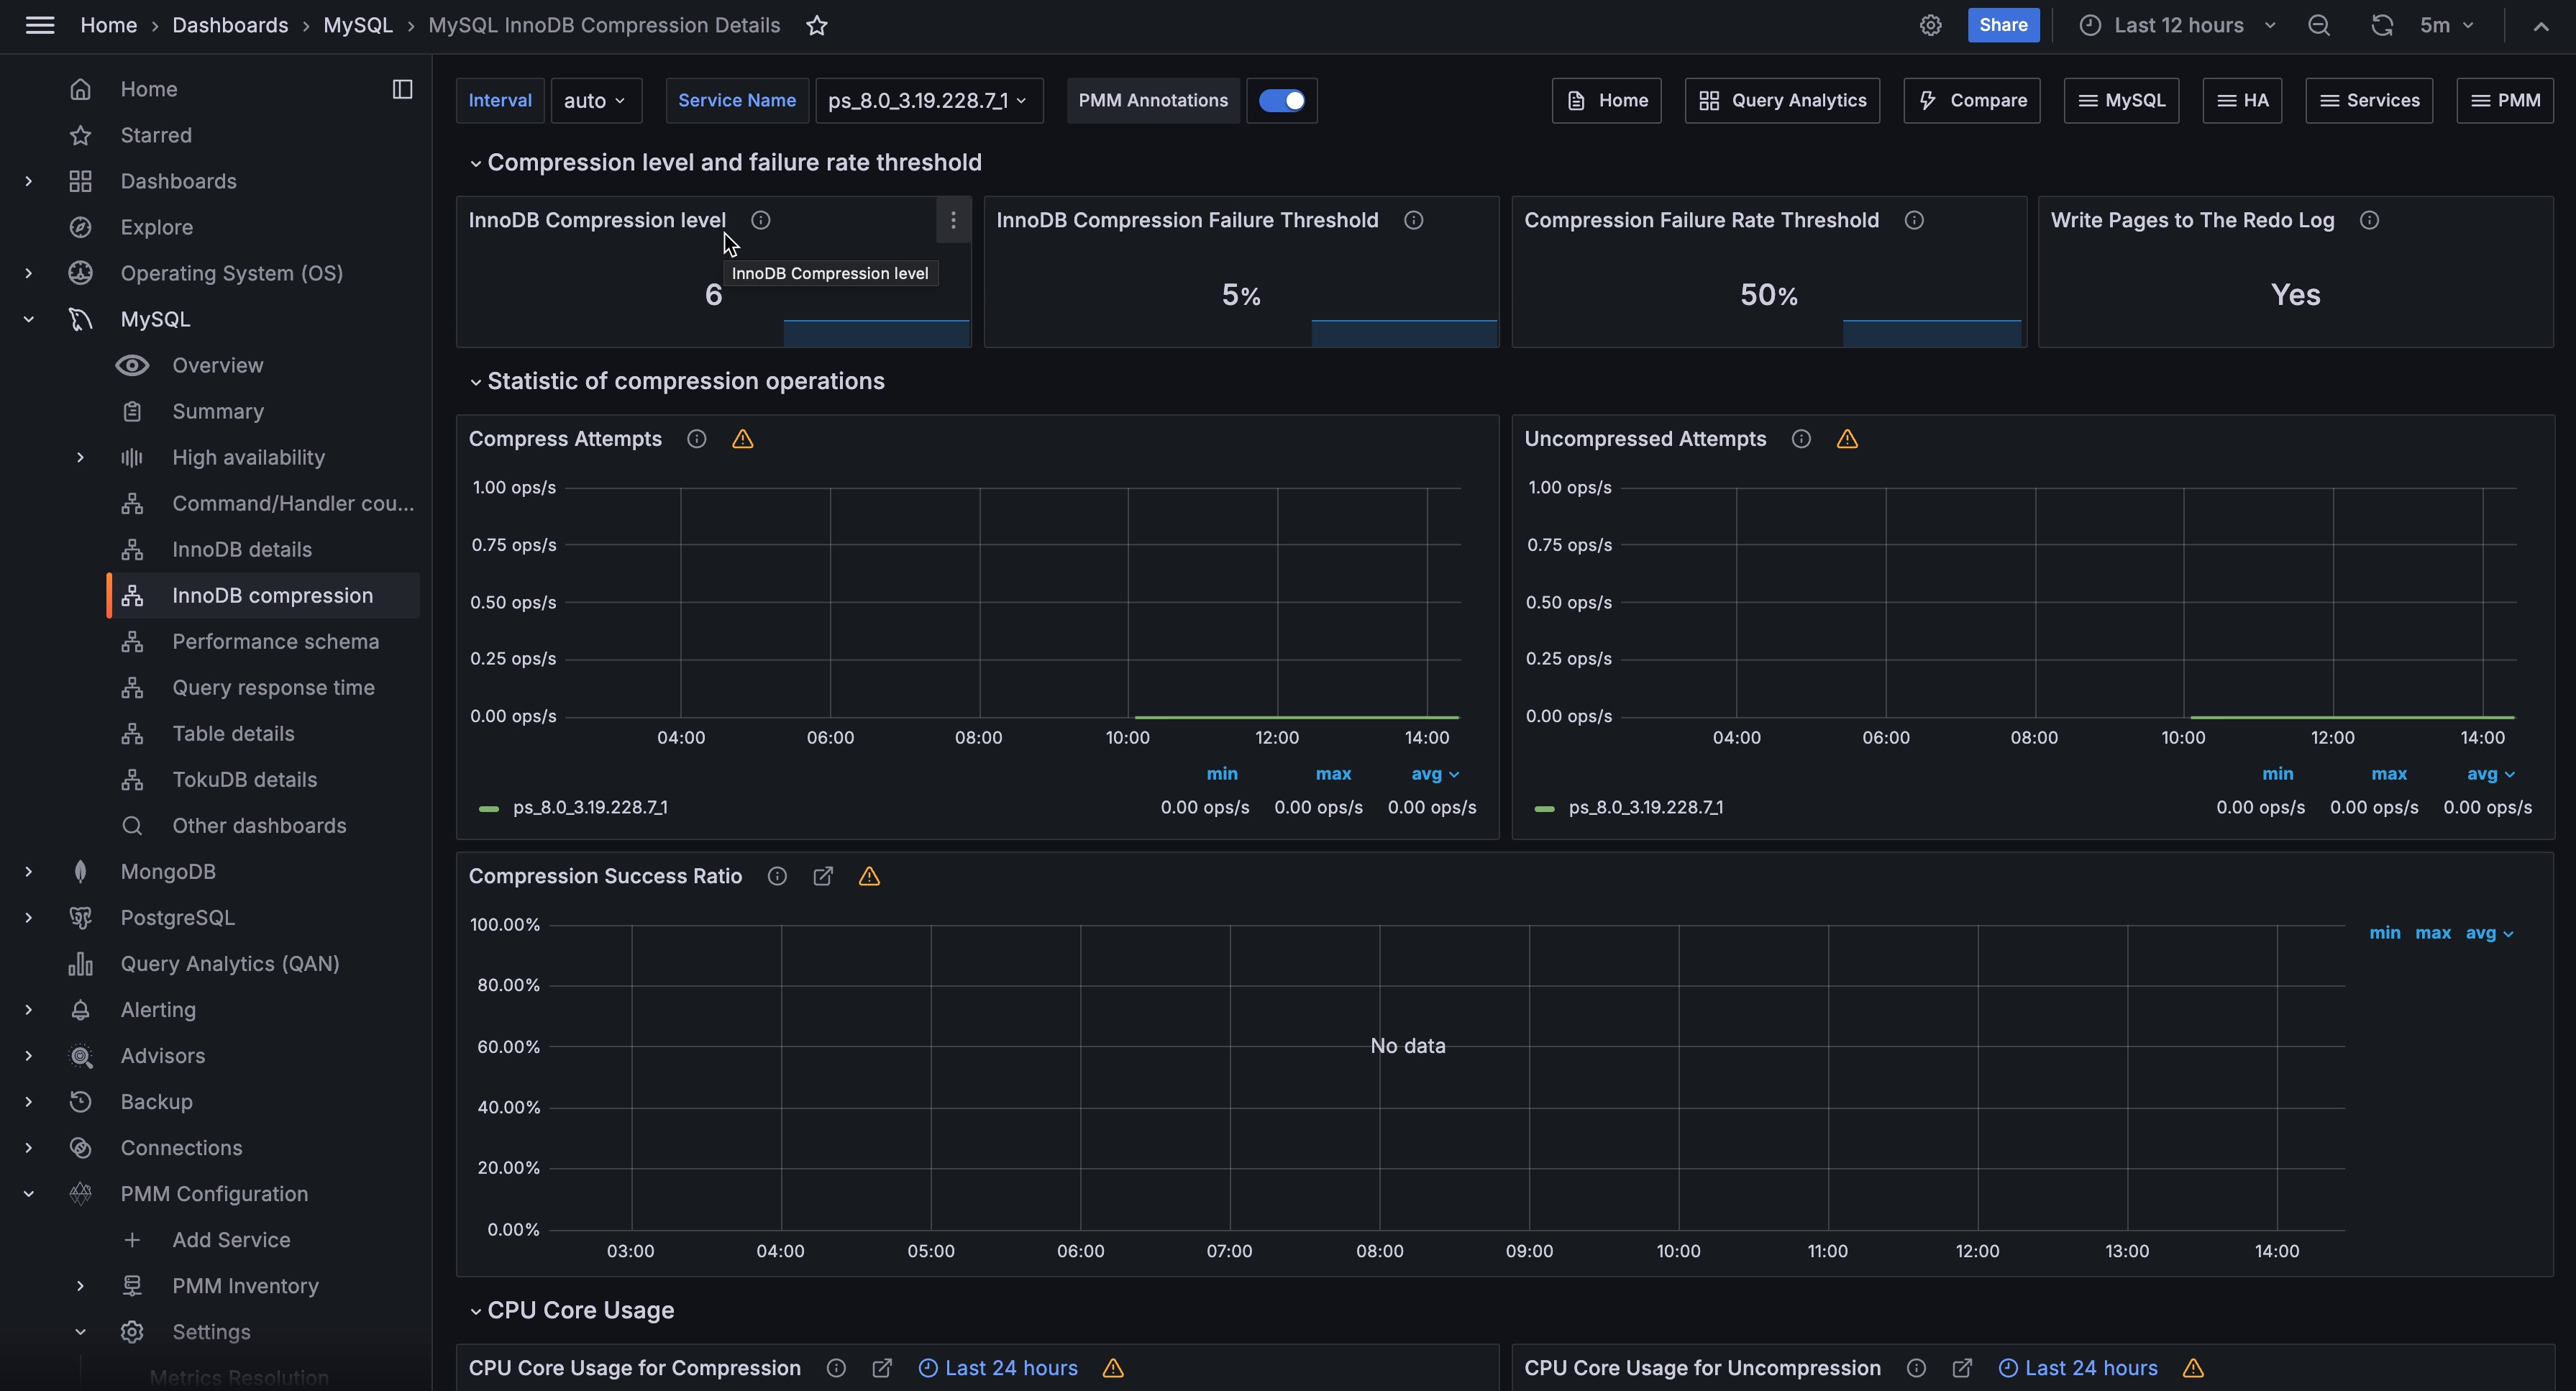
MySQL InnoDB Compression Details

This dashboard helps you analyze the efficiency of InnoDB compression.
Compression level and failure rate threshold
- InnoDB Compression Level
- The level of zlib compression to use for InnoDB compressed tables and indexes.
- InnoDB Compression Failure Threshold
- The compression failure rate threshold for a table.
- Compression Failure Rate Threshold
- The maximum percentage that can be reserved as free space within each compressed page, allowing room to reorganize the data and modification log within the page when a compressed table or index is updated and the data might be recompressed.
- Write Pages to the Redo Log
- Specifies whether images of re-compressed pages are written to the redo log. Re-compression may occur when changes are made to compressed data.
Statistic of compression operations
- Compress Attempts
- Number of compression operations attempted. Pages are compressed whenever an empty page is created or the space for the uncompressed modification log runs out.
- Uncompressed Attempts
- Number of uncompression operations performed. Compressed InnoDB pages are uncompressed whenever compression fails, or the first time a compressed page is accessed in the buffer pool and the uncompressed page does not exist.
CPU Core Usage
- CPU Core Usage for Compression
- Shows the time in seconds spent by InnoDB Compression operations.
- CPU Core Usage for Uncompression
- Shows the time in seconds spent by InnoDB Uncompression operations.
Buffer Pool Total
- Total Used Pages
- Shows the total amount of used compressed pages into the InnoDB Buffer Pool split by page size.
- Total Free Pages
- Shows the total amount of free compressed pages into the InnoDB Buffer Pool split by page size.
Get expert help
If you need assistance, you can find comprehensive and free database knowledge on our community forum or blog posts. For professional support and services, contact our Percona Database Experts.