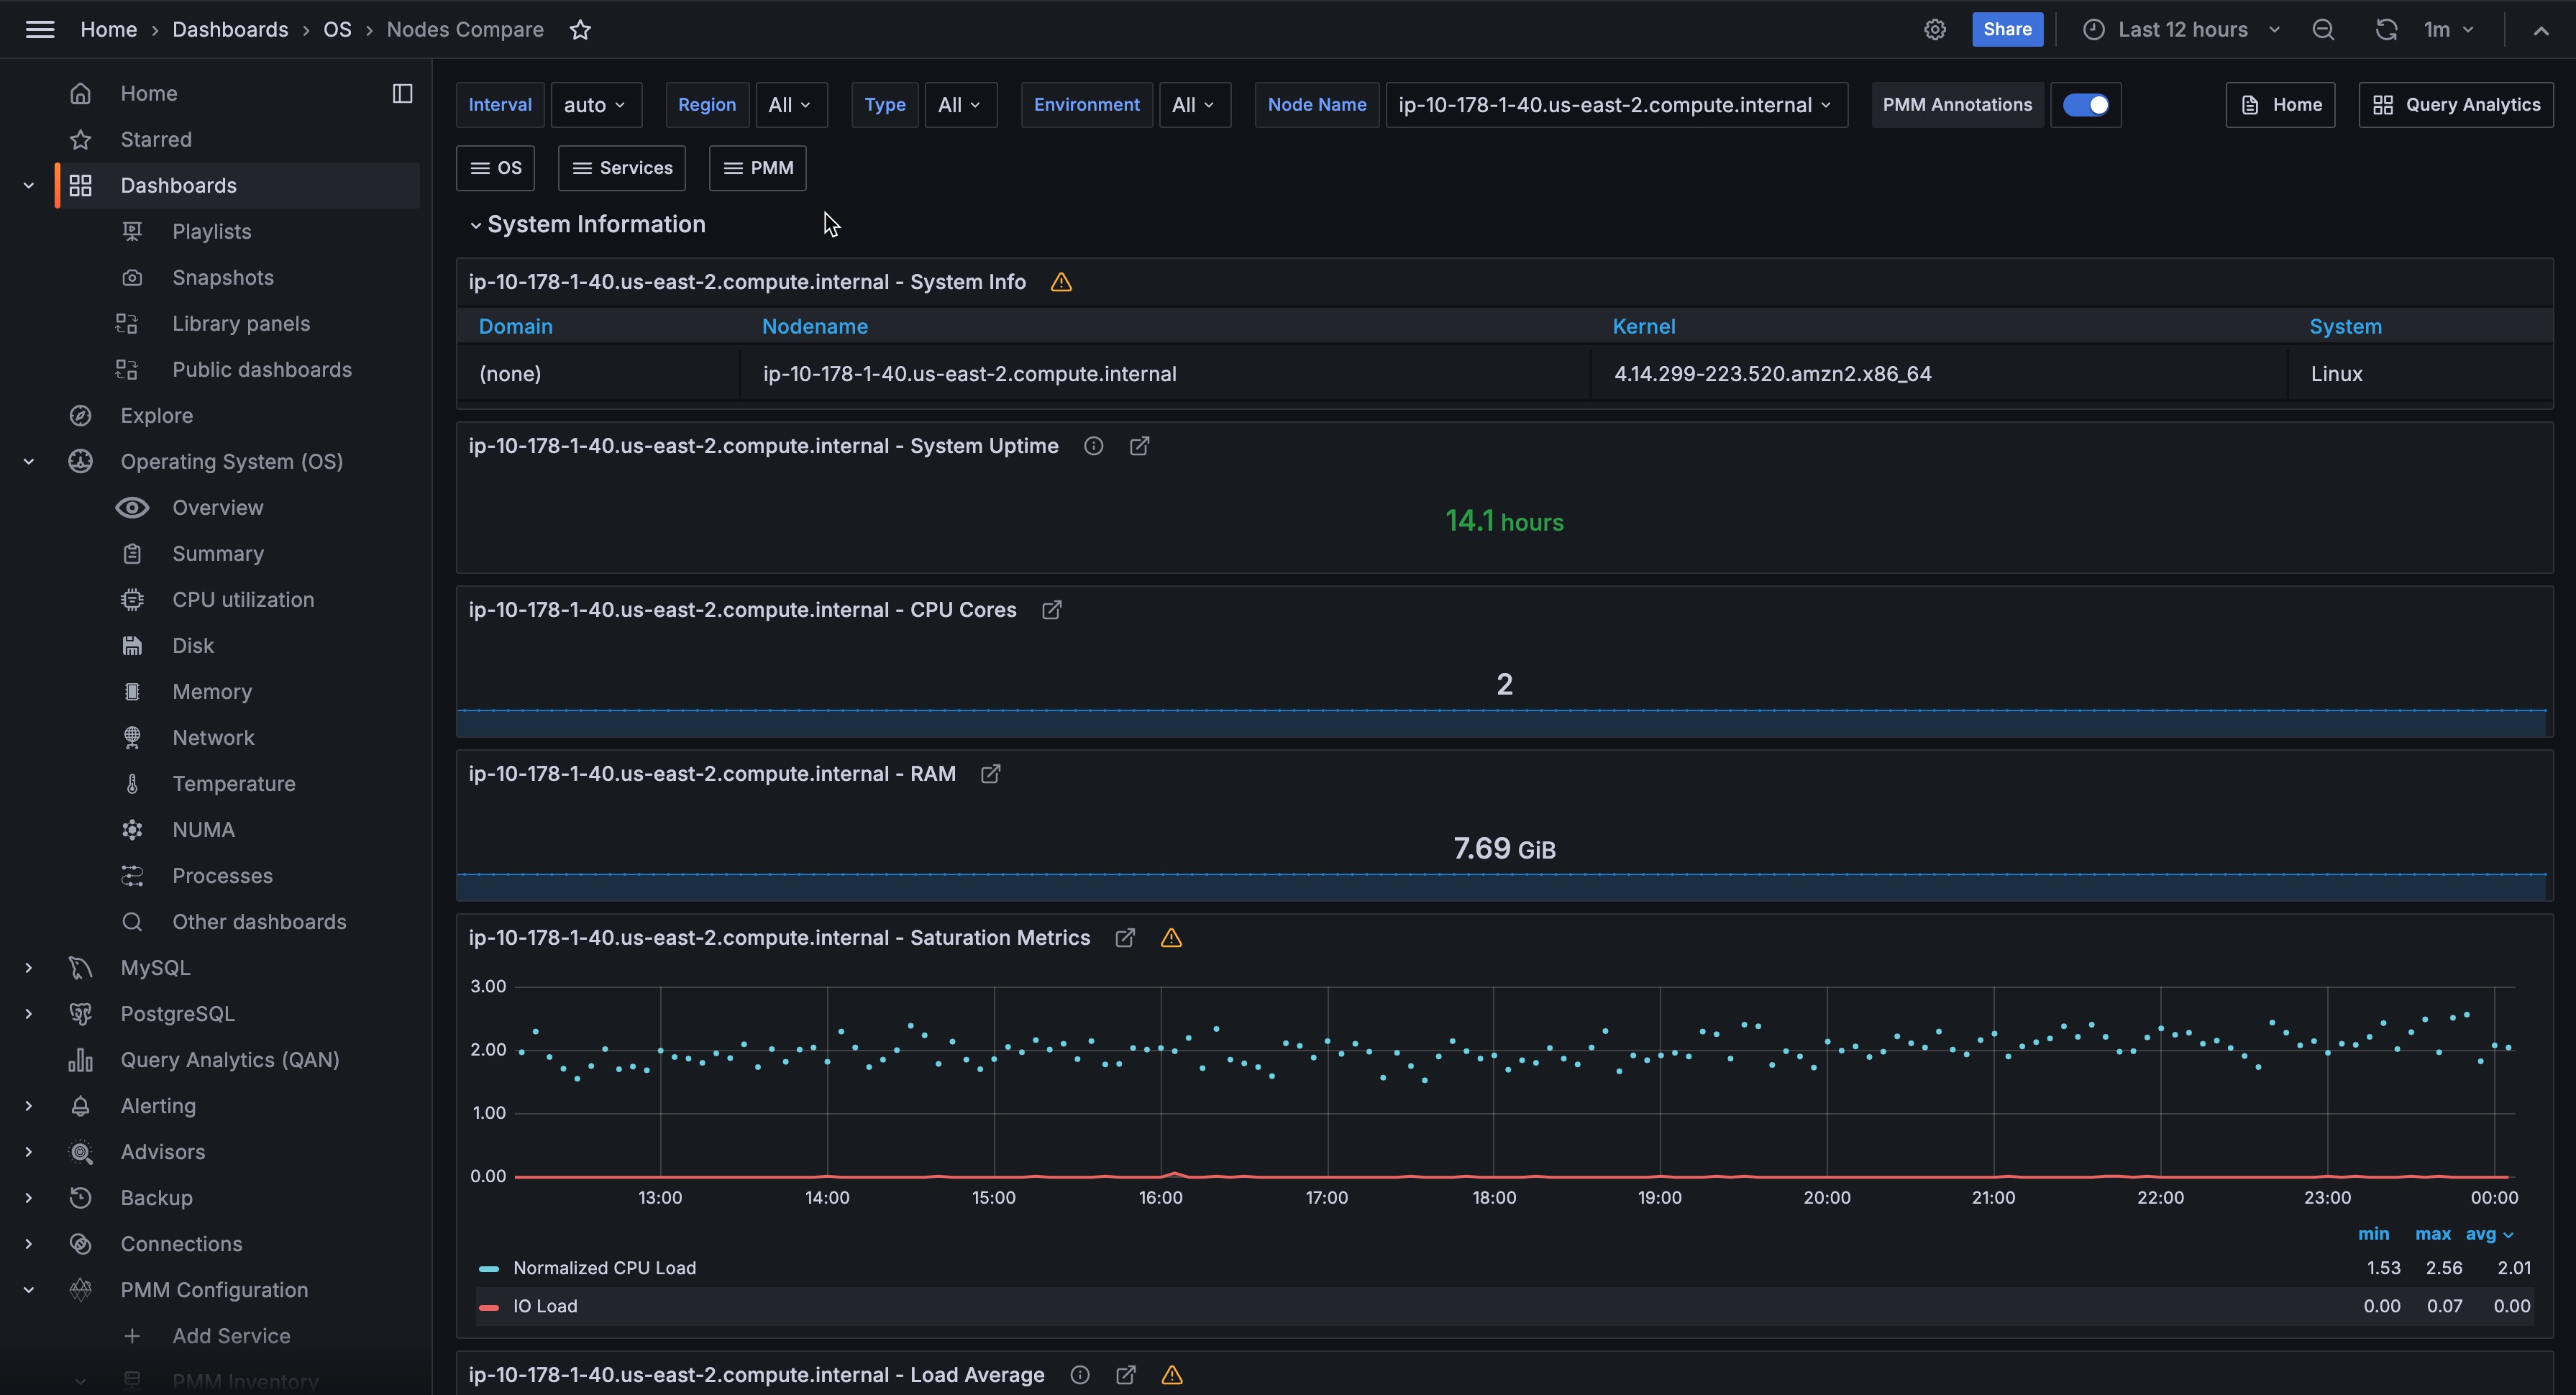
Nodes Compare

This dashboard lets you compare a wide range of parameters. Parameters of the same type are shown side by side for all servers, grouped into the following sections:
- System Information
- CPU
- Memory
- Disk Partitions
- Disk Performance
- Network
The System Information section shows the System Info summary of each server, as well as System Uptime, CPU Cores, RAM, Saturation Metrics, and Load Average gauges.
The CPU section offers the CPU Usage, Interrupts, and Context Switches metrics.
In the Memory section, you can find the Memory Usage, Swap Usage, and Swap Activity metrics.
The Disk Partitions section encapsulates two metrics, Mountpoint Usage and Free Space.
The Disk Performance section contains the I/O Activity, Disk Operations, Disk Bandwidth, Disk IO Utilization, Disk Latency, and Disk Load metrics.
Finally, Network section shows Network Traffic, and Network Utilization Hourly metrics.
Get expert help
If you need assistance, you can find comprehensive and free database knowledge on our community forum or blog posts. For professional support and services, contact our Percona Database Experts.