Home Dashboard
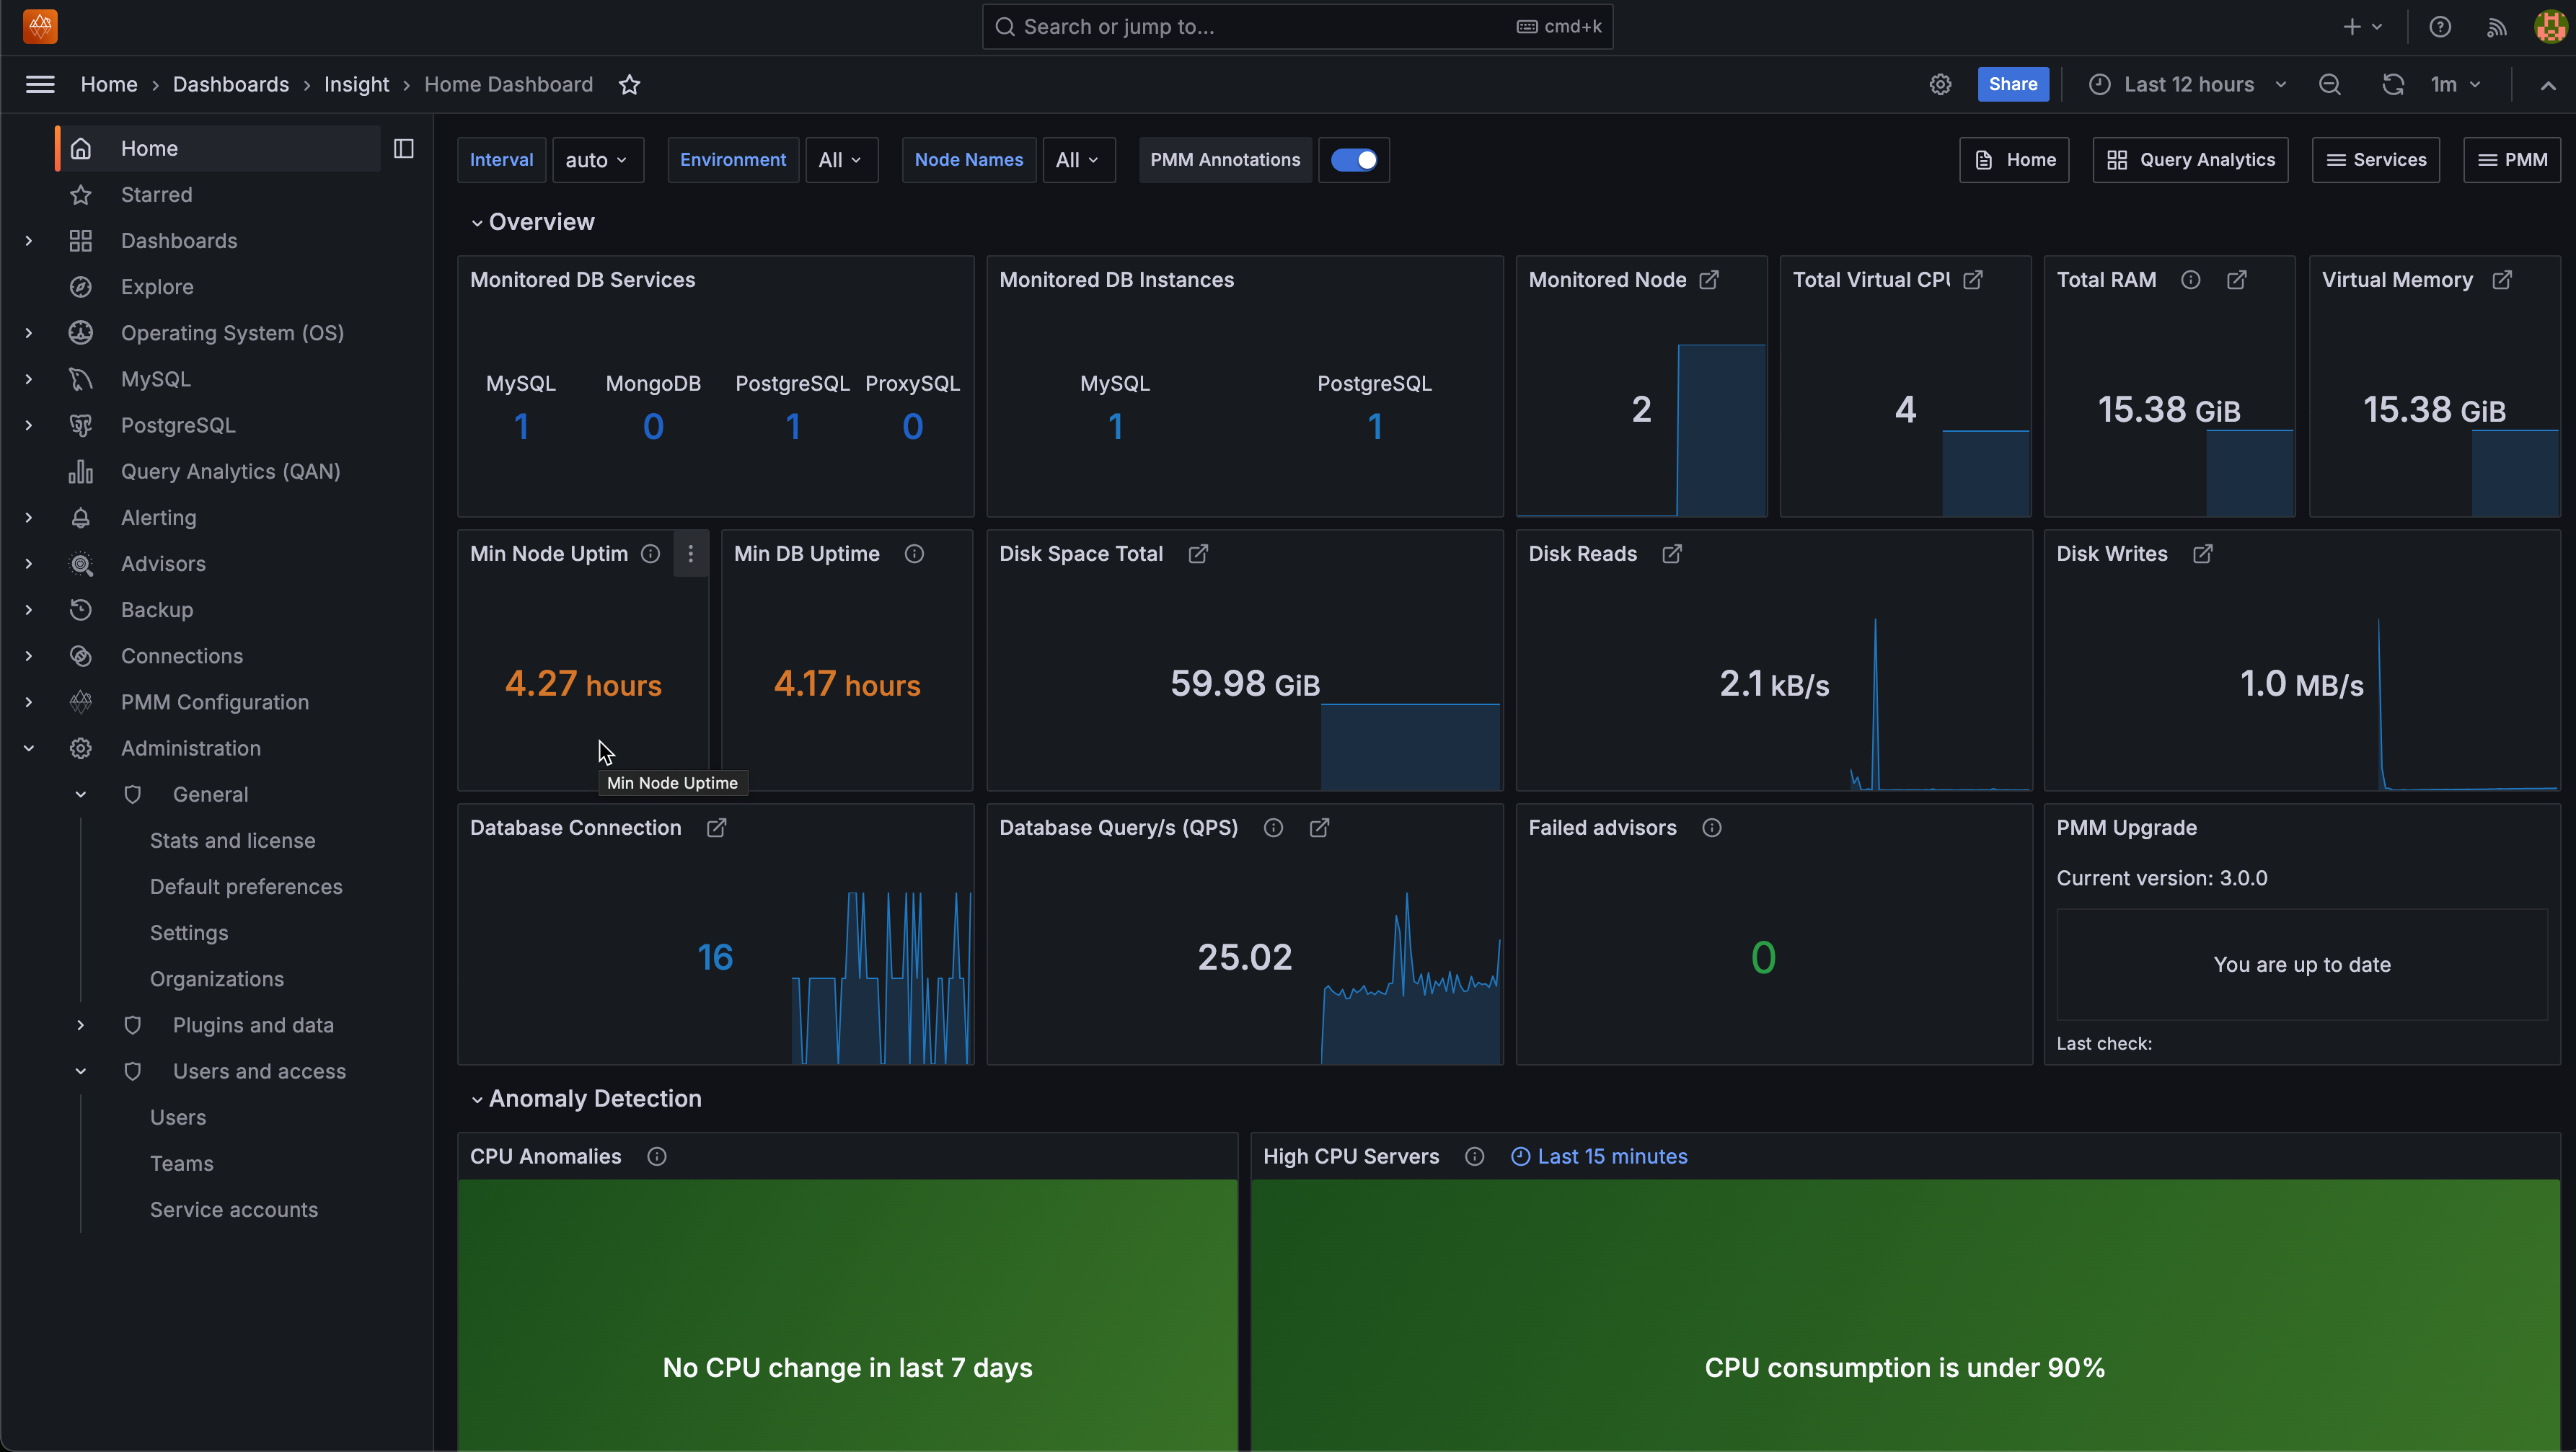
The Home Dashboard provides a high-level overview of your environment, such as the services, infrastructure, and critical issues (if any). It is the starting page of PMM from which you can open the tools of PMM and browse online resources.
This Home Dashboard displays data that is organized in panels as given below.

Overview
This panel lists all added hosts along with essential information about their performance. For each host, you can find the current values of the following metrics:
- Monitored DB Services
- Monitored DB Instances
- Monitored Nodes
- Memory Available
- Disk Reads
- Disk Writes
- Network IO
- DB Connections
- DB QPS
- Virtual CPUs
- RAM
- Host Uptime
- DB Uptime
- Advisors check
This panel also displays the current version number. Use Upgrade to X.X.X version to upgrade to the most recent version of PMM.
Anomaly Detection
The Anomaly Detection panel lists all the anomalies in your environment. Color-coded states on the panels provide a quick visual representation of the problem areas.
The following anomalies are displayed on this panel:
- CPU anomalies (high as well as low)
- High CPU servers
- Low CPU servers
- Disk Queue anomalies
- High disk queue
- High Memory Used
Command Center
You can find critical information such as CPU utlization, memory utilization, anomalies, read and write latency, etc., about your environment on the Command Center panel.
The information is represented graphically on the Command Center panel. In this panel, the graphs for the last hour and the previous week are displayed adjacently, making it easy to identify the trends.
The following information is displayed on the Command Center for the Top 20 nodes:
- CPU usage
- Disk queue
- Disk Write latency
- Disk Read latency
- Memory usage
Command Center lists the
Service Summary
The Service Summary panel provides the following information for the services being monitored:
- DB connections
- DB QPS (Query per sec)
- DB uptime
Get expert help
If you need assistance, you can find comprehensive and free database knowledge on our community forum or blog posts. For professional support and services, contact our Percona Database Experts.